Choosing the Right Classification Metric: Lessons from Class Imbalance
Published: May 2025
By Amy Humke, Ph.D.
Founder, Critical Influence
The binary classification task initially seemed straightforward when working on a project to predict student enrollment from applications. The project was similar to an earlier model someone on the team had worked on, though this time with new data constraints. The class imbalance was a known issue; most students who applied ultimately did not enroll. Instinctively, I reused the same metric as before: the F1-score. After all, accuracy can be misleading when classes are imbalanced, right?
At the time, it felt like a safe, obvious choice. The F1-score, balancing precision (the percentage of correct optimistic predictions) and recall (the percentage of actual positives identified), seemed the right fit. There was no immediate business directive to prioritize minimizing false positives over false negatives, so using F1 seemed logical.
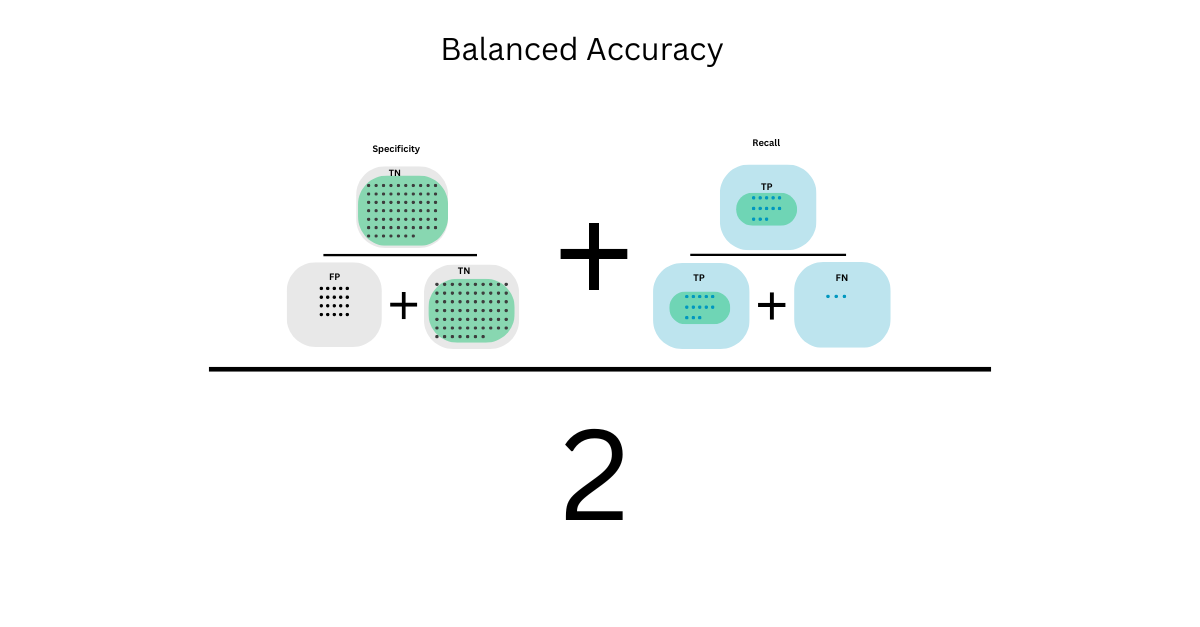
Weeks later, I stumbled upon an article discussing balanced accuracy, and it hit me: I'd overlooked something critical. Balanced accuracy calculates the average of sensitivity (recall for the positive class) and specificity (recall for the negative class), ensuring both classes are considered equally, regardless of their frequencies. F1, on the other hand, does not consider the true negatives in its calculations and, therefore, ignores 1/4 of the confusion matrix.
In this project, the stakeholders cared deeply about overall correctness. They weren't solely focused on capturing the maximum number of enrollments (recall) or minimizing false positives (precision). They needed balanced, reliable identification of both enrollments and non-enrollments. Balanced accuracy better aligns with these priorities.
This realization changed how I approach metric selection. I no longer default based on habit. Instead, I consciously pause, check my assumptions, and select the best metric for the specific business context.
Why Metric Choice Matters
Defining key evaluation metrics is critical before diving into techniques for handling imbalance. Visualizing these metrics using confusion matrices clarifies what they measure and miss.
Precision
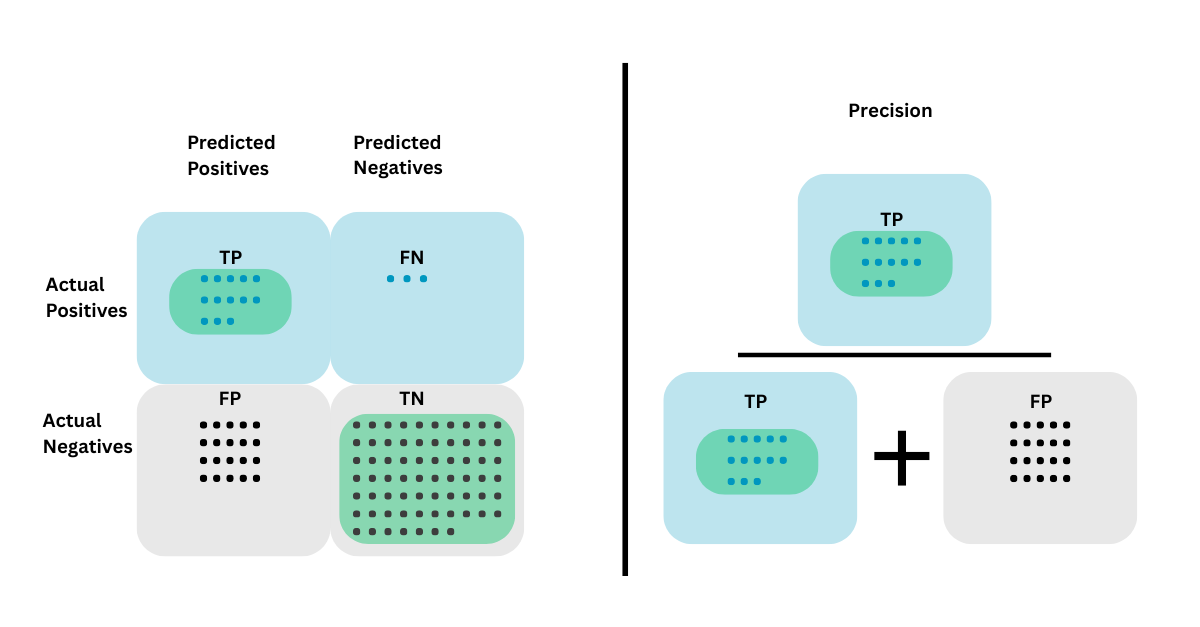
Precision measures the proportion of true positives out of all predicted positives. If the cost of false positives is high, precision matters most. In spam filtering, for instance, incorrectly marking a critical email as spam can be disruptive. Precision protects against that.
Recall
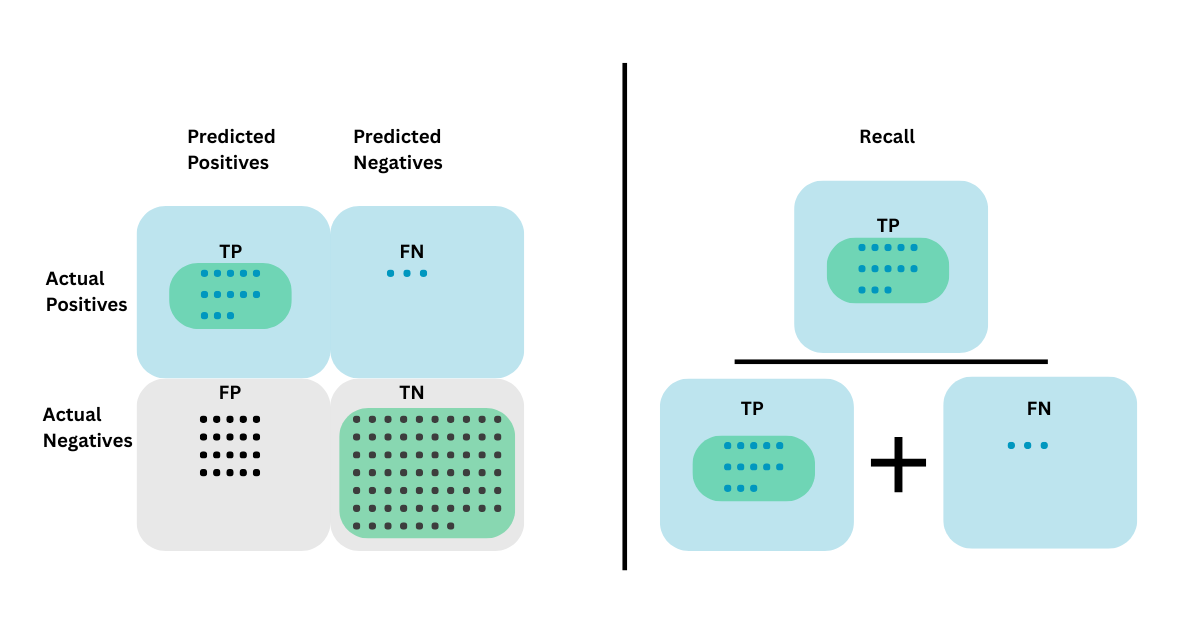
Recall measures the proportion of true positives out of all actual positives. If missing a positive instance is more damaging, recall becomes crucial. In medical diagnosis, missing a disease case is far riskier than flagging a healthy patient for further testing.
F1-Score
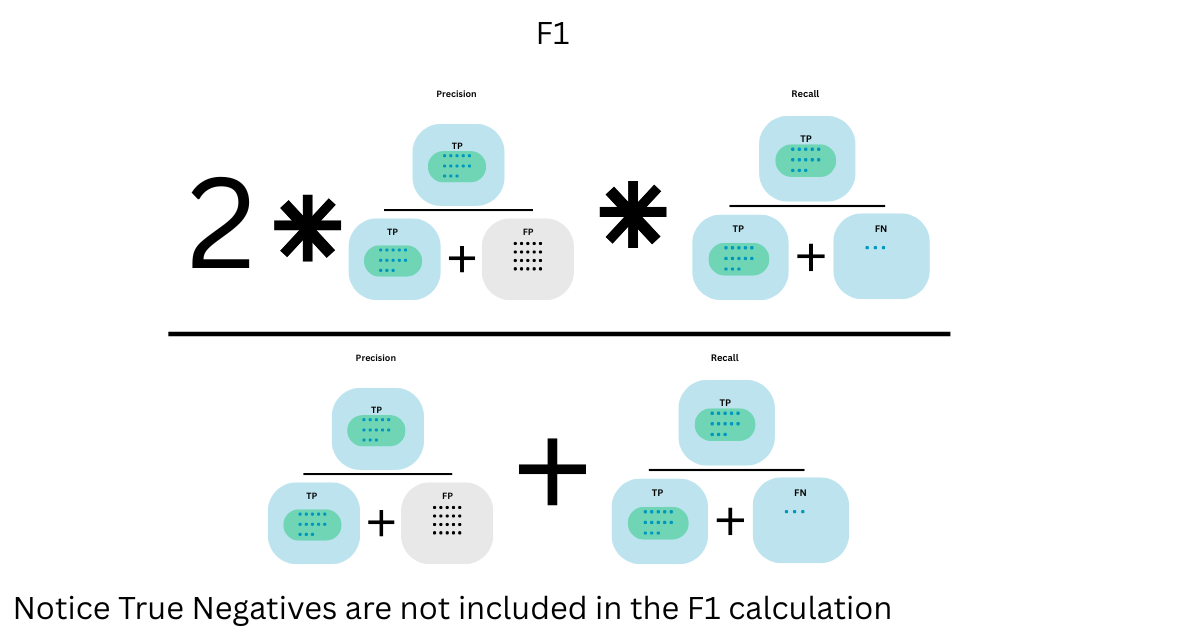
The F1-score is the harmonic mean of precision and recall. It's useful when you need a single score to balance the two. However, notice from the visual: true negatives are entirely excluded from the calculation. If your business stakeholders care equally about all types of classifications, F1 may miss important aspects of model performance.
Balanced Accuracy
Accuracy is the measure most are familiar with as it's the most straightforward metric evaluation and measures overall percent correct model categorization. The problem with accuracy arises in a highly imbalanced dataset; a model could achieve high accuracy simply by always predicting the majority class.
For example, if 95% of students don't enroll, a model that always predicts "no enrollment" would be 95% accurate but entirely useless for identifying who will enroll.
Balanced accuracy can solve this problem. It averages sensitivity (recall for the positives) and specificity (recall for the negatives). It treats both classes equally, which becomes crucial when the dataset is imbalanced.
Balanced accuracy ensures the model isn't just predicting the majority class correctly but is performing well across all classes. While standard accuracy is easier to explain to non-technical audiences and often more familiar to business users, balanced accuracy offers a more honest assessment when class imbalance exists.
In real-world settings where minority outcomes matter, such as fraud detection, rare disease diagnosis, and student enrollment prediction, balanced accuracy can highlight strengths and weaknesses that regular accuracy obscures.
Why Balanced Accuracy Is Often Overlooked
Many data scientists are taught early on that "accuracy is misleading on imbalanced datasets"—a warning that is heavily reinforced, and for good reason. However, this message often leads to broadly avoided accuracy-based metrics, including balanced accuracy, which was specifically designed to correct for class imbalance.
At the same time, standard teaching heavily emphasizes the F1 score as the primary solution when neither precision nor recall is preferred. Balanced accuracy, if it appears at all, tends to be mentioned briefly or as a side note. As a result, many practitioners aren't trained to recognize when balanced accuracy is a stronger fit, especially in situations where overall correctness across both classes is equally important.
When a class imbalance exists and both outcomes matter, balanced accuracy provides a more precise, fairer evaluation than standard accuracy or F1. It's not overlooked because it's ineffective. It's ignored because it's under-taught and under-utilized.
Quick Overview of Other Metrics
| Metric | Description | When to Use |
|---|---|---|
| Brier Score | Measures how well probability predictions are calibrated. Lower is better. | When probability calibration matters. |
| Log Loss | Penalizes incorrect probability predictions, punishing confident wrong answers. | When sharp, confident probability estimation is critical. |
| AUC/ROC | Measures model's ability to rank positives higher than negatives. | When threshold flexibility is needed. |
| Matthews Correlation Coefficient | Considers all four quadrants of the confusion matrix. | When you want a stricter, holistic metric. |
These metrics each have specific use cases, but balanced accuracy deserves serious consideration when the goal is balanced assessment across classes in an imbalanced situation.
Challenges of Class Imbalance
Even after identifying the correct metric, imbalanced datasets carry additional challenges:
- Accuracy Paradox: High overall accuracy may mask terrible minority class performance.
- Unequal Misclassification Costs: The business impact of false positives and negatives may differ greatly.
- Model Bias: Standard machine learning algorithms favor the majority class unless deliberately adjusted.
Recognizing these challenges early helps you select appropriate metrics and methods rather than simply optimizing for misleading results.
Strategies to Address Class Imbalance
Resampling
Adjust the training data to balance classes through oversampling (e.g., SMOTE) or undersampling.
Pros: - Simple to implement. - Improves minority class exposure.
Cons: - Risk of overfitting with oversampling. - Risk of losing valuable information with undersampling.
Algorithmic Approaches
Use models that can handle imbalance inherently (e.g., XGBoost, Balanced Random Forest).
Pros: - Built-in handling of imbalance. - Strong predictive performance.
Cons: - Complexity in tuning. - May sacrifice model interpretability.
Cost-Sensitive Learning
Assign different costs to different types of misclassification.
Pros: - Aligns directly with business outcomes. - Highly customizable.
Cons: - Defining appropriate costs can be difficult.
Class Weights
Algorithms like logistic regression and XGBoost allow class weights to be adjusted (class_weight or scale_pos_weight).
Pros: - Simple and effective. - Minimal code changes needed.
Cons: - Requires careful calibration. - Misconfigured weights may harm model performance.
Common Pitfalls to Avoid
- Improper Data Splitting: Always resample after splitting into train/test sets.
- Ignoring True Prevalence: Artificial balancing can distort real-world performance expectations.
- Incorrect Cross-Validation: Resample within each cross-validation fold, not across the entire dataset.
Final Reflection: Metrics Are Business Decisions
What did I learn from this misstep? Metrics aren't neutral. They're strategic decisions deeply tied to business priorities. Now, before I model anything, I ask:
- What's the real-world cost of false positives versus false negatives?
- Is overall correctness or sensitivity to a particular class more important?
- Should probability calibration or class ranking matter?
Choosing the right metric isn't about ticking boxes but about making data actionable. And sometimes, the best answer isn't the most popular one. Sometimes it's balanced accuracy.