Your Model Is Lying to You: Why Calibration Matters
Published: May 2025
By Amy Humke, Ph.D.
Founder, Critical Influence
I still remember the rush of my first real machine learning project. After weeks of wrangling data, selecting features, and obsessing over hyperparameters, I'd finally hit the target. It seemed that I had been playing with feature selection and feature engineering for an eternity. I was ready to be done.
The model performed beautifully on the training data, and F1 scores were right where they needed to be. For a brief moment, I sat back, convinced the job was done.
Then someone asked, "But how does it perform on the test set?"
Cue the plot twist.
The test performance wasn't hitting the target, and the train barely hit it. So, I went back to feature engineering and hyperparameter tuning. Performance improved a bit more. And just as I was ready to celebrate, another question dropped:
"Have you calibrated the model yet?"
Calibrated? That wasn't in any of the tutorials I had read. It felt like this project would never end. Whenever I thought the model was "ready," another hidden layer of responsibility emerged.
That's when I learned one of the most important lessons in data science:
It's not enough to predict outcomes; you have to predict them honestly.
What Is Calibration, and Why Does It Matter?
Calibration ensures that the model's predicted probabilities reflect reality.
If your model predicts a 90% chance that an event will occur, does that happen 9 out of 10 times in reality? Or is your model overconfident?
Without calibration, you might be feeding decision-makers numbers that look precise but have no basis in reality. And in the real world, where decisions are made based on probabilities, that's a dangerous game.
📌 When Calibration Is the Priority:
- Decisions rely on the probability value itself
If you're making different choices based on whether a prediction is 60% vs. 90%, calibration ensures those numbers reflect real-world likelihoods. - You're estimating totals or business impact
When you sum predicted probabilities to forecast outcomes (e.g., conversions, churn, fraud cases), well-calibrated scores lead to better volume estimates. - Thresholds affect real-world actions
Choosing an operating threshold is more effective when probabilities are reliable, especially with imbalanced data. - You're communicating model output to stakeholders
Calibrated probabilities build trust and avoid misleading confidence if predictions are shown in dashboards or reports. - Cost or risk varies by probability level
In lending or healthcare, the degree of risk affects what's done next. Calibration ensures you're not over- or underreacting.
📌 When Calibration Isn't the Priority:
- You only care about relative ranking
- You're only using hard classification
- Outputs are used internally for triage or filtering
- You're optimizing ranking-based metrics like AUC
- Probabilities aren’t shown or interpreted
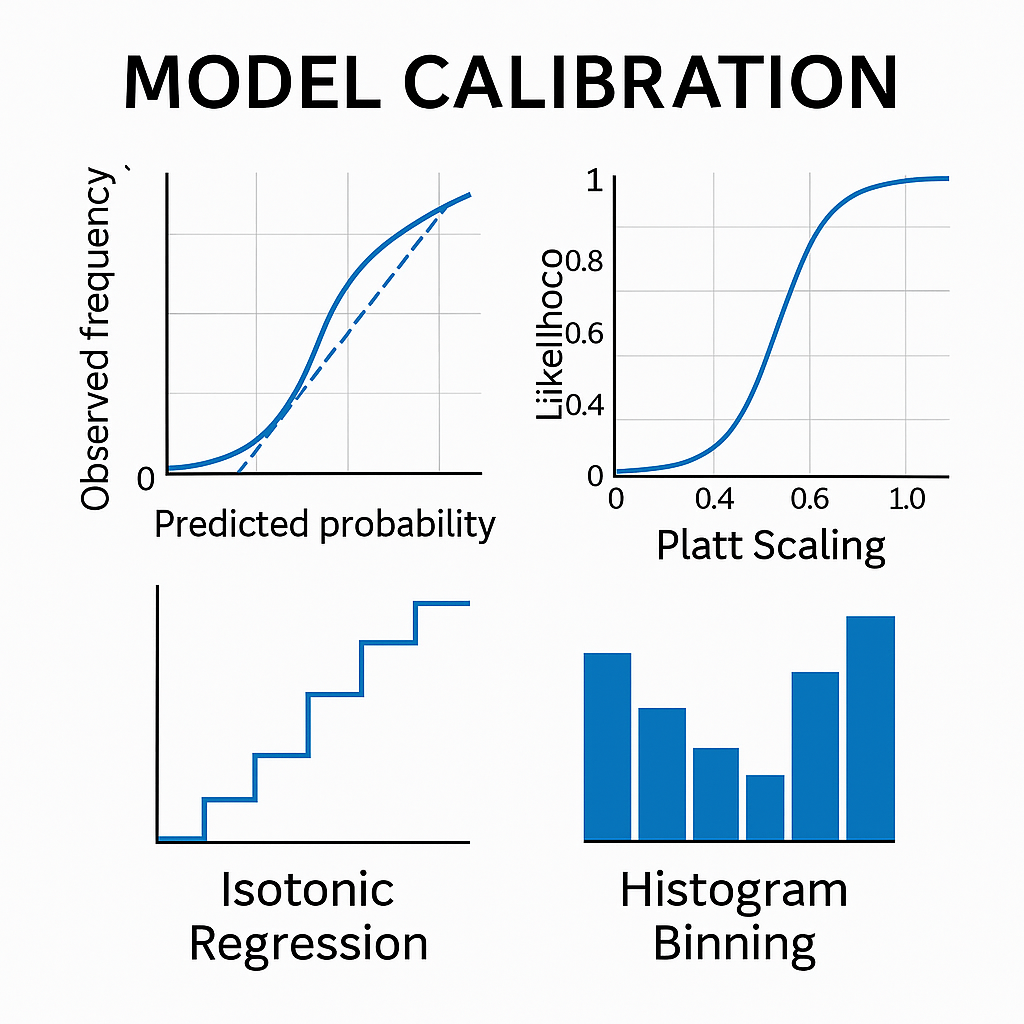
How to Know If a Model Is Well-Calibrated
Step 1: Visual Inspection – The Reliability Diagram
This plots predicted probabilities against observed frequencies.
- A perfectly calibrated model follows the 45° line.
- Points above the line indicate underconfidence.
- Points below the line reveal overconfidence.
🔹 Pro Tip: If the curve looks like an S, your model is systematically over- and underconfident in different ranges.
Step 2: Quantitative Evaluation
| Metric | What It Measures | Ideal Value |
|---|---|---|
| Expected Calibration Error (ECE) | Avg. gap between confidence & actual outcomes | < 0.05 |
| Brier Score | Mean squared difference between prob. & outcome | < 0.1 |
| Maximum Calibration Error (MCE) | Largest difference in any bin | As low as possible |
| Calibration Slope | Should be close to 1 | ~1 |
| Calibration Intercept | Measures bias | ~0 |
Calibration Slope:
- Slope < 1 = Overconfident
- Slope > 1 = Underconfident
Should You Adjust Thresholds Before or After Calibration?
Always calibrate first, then tune thresholds.
Calibration fixes the scale of the probabilities.
Threshold tuning decides how to act on those probabilities.
Think of it like fixing a faulty thermometer before deciding what to wear.
Which Calibration Method Should You Use?
| Method | Type | When to Use | Pros | Cons |
|---|---|---|---|---|
| Platt Scaling | Parametric | Small datasets, S-shaped distortion | Fast, interpretable | Assumes sigmoid shape |
| Isotonic Regression | Non-parametric | Complex distortion, large datasets | Flexible, no assumptions | Can overfit small data, ties |
| Histogram Binning | Non-parametric | Quick fixes or baselines | Simple, easy | Bin size sensitivity, discontinuities |
📚 Deep Dive: Platt vs. Isotonic
- Platt fits a sigmoid curve. Works well for smoother miscalibration, especially in small datasets.
- Isotonic makes no assumptions. Captures complex shapes but needs more data and may affect ranking performance.
Defining Success: What's a Good Enough Calibration?
| Metric | Good Value |
|---|---|
| Brier Score | < 0.1 = excellent |
| ECE | < 0.05 = solid |
| Slope | ~1 |
| Intercept | ~0 |
Context matters.
Healthcare and finance often demand tighter calibration than other fields.
How Calibration Affects Performance Metrics
| Metric | Impacted By Calibration? | Note |
|---|---|---|
| Balanced Accuracy/F1 | Not directly | Helps pick better thresholds |
| Precision & Recall | Indirectly | Better thresholding |
| AUC/ROC | Unchanged (unless ties are introduced) | Ties can occur with isotonic regression |
Additional Visual Checks: How to See Calibration in Action
1. Histogram of Predicted Probabilities
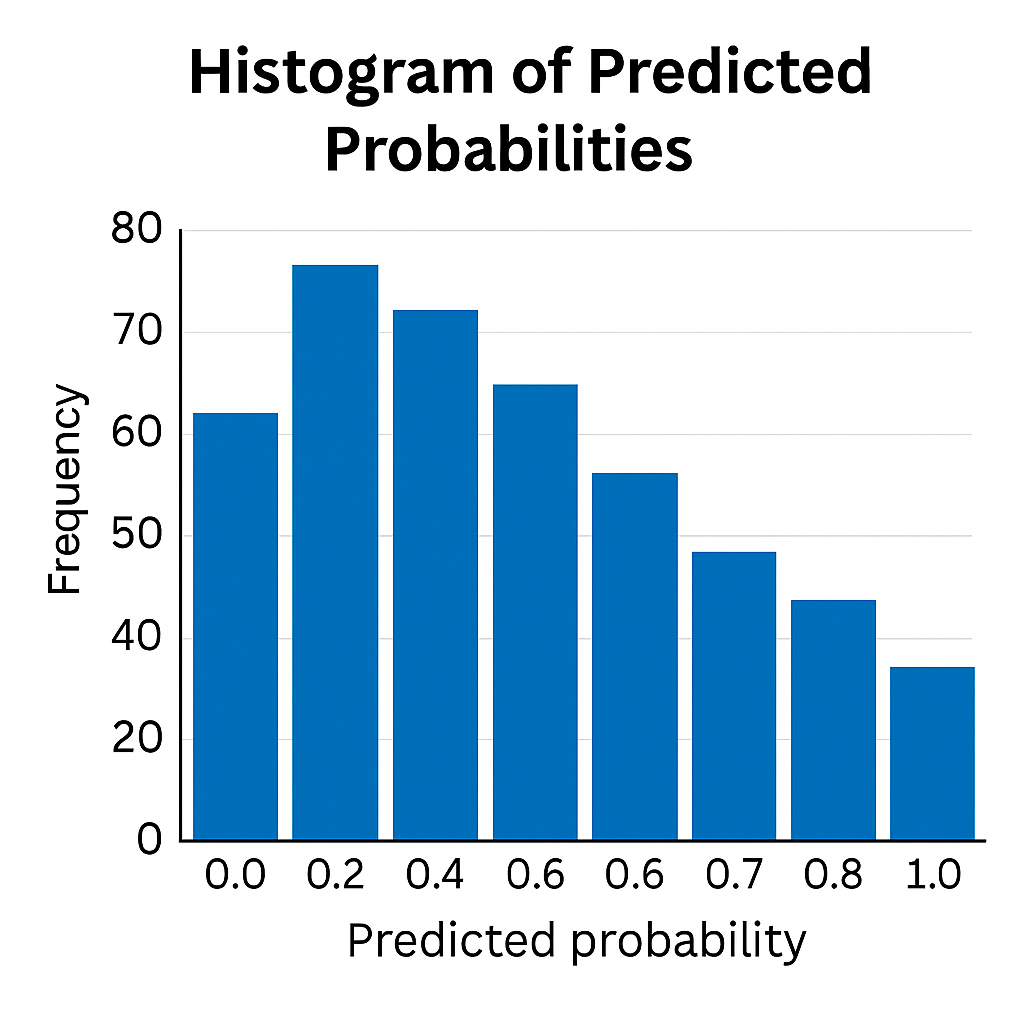
X-axis: predicted probability
Y-axis: frequency of predictions
Why it’s useful:
- Spikes at 1.0 = overconfidence
- Bunched middle = underconfidence
- Flat or graduated = more useful distribution
2. Ventile or Decile Analysis
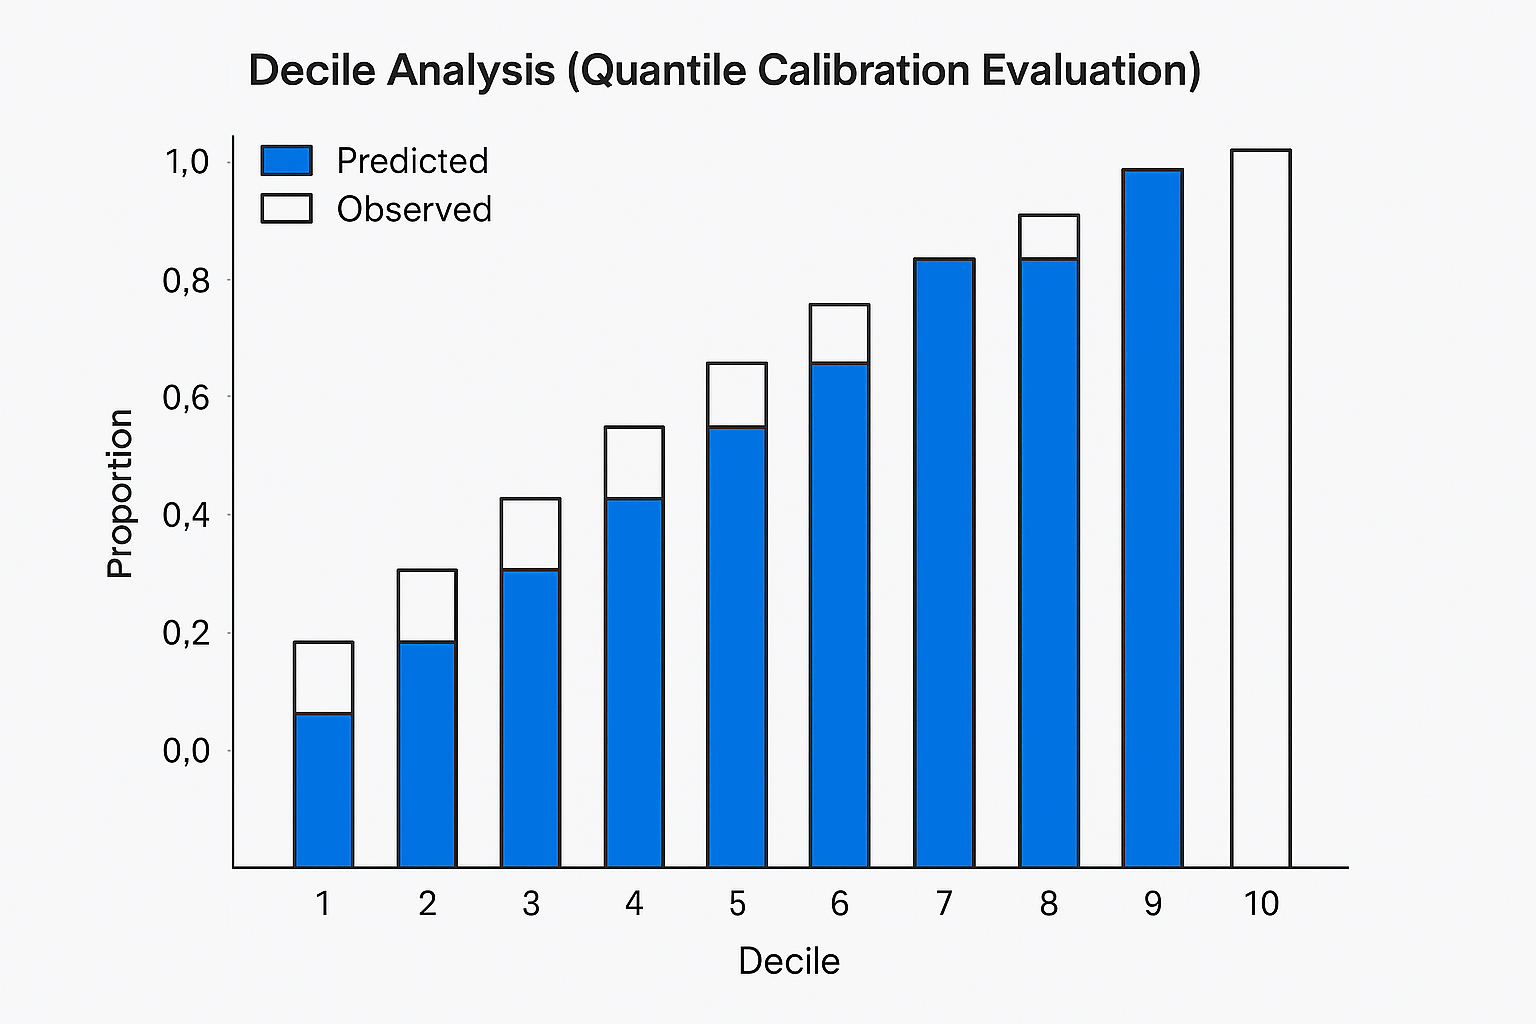
Split predictions into 10 or 20 equal-sized groups.
Compare average predicted probability vs. observed outcome rate.
What to look for:
- < 5% absolute error per group = acceptable
- < 2% = excellent real-world calibration
3. Cumulative Percent Positive Curve (a.k.a. Gain Curve)
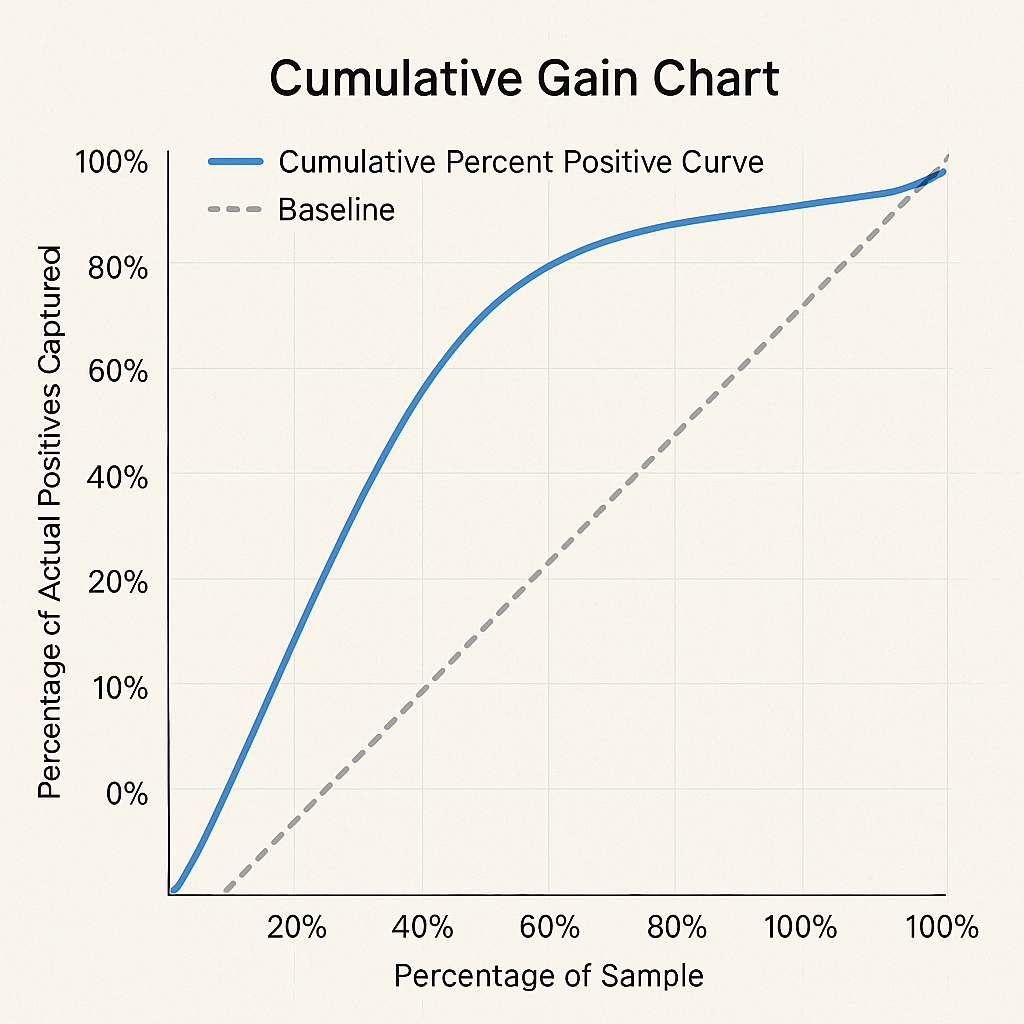
X-axis: % of population (sorted by probability)
Y-axis: % of actual positives captured
What to look for:
- Steep curve early = strong prioritization
- Top 10% capturing >30–40% of positives = strong performance
Summary: Choosing the Right Visual
| Visual | Use Case | Good Indicator |
|---|---|---|
| Histogram of Probabilities | Understand model confidence | Wide or graduated spread |
| Decile/Ventile Analysis | Compare predicted vs. actual | < 5% absolute error per group |
| Cumulative Gain Curve | Evaluate prioritization | Top 10% captures >30% of true positives |
Final Thought: From Prediction to Trust
Early in my career, I thought the finish line was about hitting the metric target.
But I've learned that models don't operate in a vacuum. They inform decisions, carry risk, and shape outcomes.
Calibration is what turns raw predictions into reliable guidance.
And when people start trusting the numbers you produce, that’s when you know you've gone from just building models…
to building models that matter.