The Hidden Reason Your Data Isn’t Driving Action
Published: August 2025
By Amy Humke, Ph.D.
Founder, Critical Influence
The real problem isn’t technical
Every data pro knows the sting. The analysis was sharp. The dashboard looked great. The model beat the baseline.
And still, no one used it. No decisions changed. No impact showed up downstream.
This is rarely a tooling problem. It is a matter of people, priorities, and concerns. Data is only actionable when those three are aligned to a decision. Without that alignment, your best work becomes background noise, and your strongest people burn out doing work that never lands.
How misalignment quietly kills adoption
A conversion model that lifted performance by a meaningful margin. The science was solid. The deployment was smooth.
A month later, the business had not changed course. Why?
Stakeholders did not know what to do with the scores. They saw “insight,” not a lever.
Misalignment hides in places like these:
- People: Leaders assume the cause. Doers build on that assumption. No one agrees on what success looks like.
- Priorities: Marketing optimizes reach, Ops optimizes efficiency, Data optimizes accuracy. Each is right in isolation and wrong together.
- Problems: You are asked, “Why are reorders down?” when the better question is, “What is normal for this segment, and what action do we take when we are outside normal?”
When even one of those is out of sync, your dashboard is a mirror, not a map.
Decision-first alignment: the operating system
Decision-first alignment flips the sequence:
- Decide the decision. Name the choice this work will change.
- Name the few leading KPIs. Define what “early movement” looks like and where it should come from.
- Set triggers and owners. Specify thresholds that force action and who moves first.
- Design the view around the action. Build the dashboard to answer “what now,” not just “what happened.”
- Close the loop. Review adoption and pain points fast to correct course before trust erodes.
Do this, and your work will stop being a report and start being a control surface.
The plays (use these tomorrow)
Play 1: The 1-page Decision Brief
Before SQL, before a Figma mock, capture this on one page:
| Template Step | Example |
|---|---|
| Decision What choice are we making with this data? |
Who gets outreach in the first 24 hours? |
| Options on the table A, B, C (no more than three). |
A) Prioritize top 20% by propensity score B) Work queue order by first in first out rule across all new leads C) Prioritize by recency + acquisition channel |
| Criteria What would make us choose A over B? |
Must hit 24-hour contact SLA (≥90%) and fairness minimum (selection parity ≥0.80). Among options that pass, choose the highest enrollments per representative work hour. |
| Leading KPIs Which early signals tell us we are headed toward or away from the goal? |
24-hour contact rate; 48-hour reply rate; queue backlog; selection parity ratio; average time to first contact. |
| Triggers Exact thresholds that force action. |
Contact rate < 70% for 2 days; reply rate < 12% for 3 days; backlog > 150 for 2 hours; parity ratio < 0.80 for 3 days. |
| Owner + first action Who moves first and what do they do? |
Owner: Outreach Manager. First action: Rebalance queues to priority bucket and shift 2 reps to high-propensity pool immediately. |
| If/then plan If metric ≥ X, do Y. If metric < X, do Z. |
If contact rate ≥ 75% and reply ≥ 15%, expand priority from top 20% to top 30%. If reply < 12%, switch to Message B and add follow-up at 48 hours. If parity < 0.80, cap any single segment at 35% of daily dials until corrected. |
| Timebox When we will decide and when we will revisit. |
Decide by Aug 15; revisit weekly on Tuesdays for adoption and pain points; recheck thresholds monthly. |
You are not ready to build if you cannot fill this out.
Play 2: Trigger–Action–Owner (TAO) cards on every Leading KPI dashboard tile
Attach a tiny Trigger–Action–Owner card to each KPI. Make it visible or one click away.
-
24-hour contact rate
- Trigger: Contact rate < 70% for 2 consecutive days
- Action: Rebalance queues to high-propensity bucket and shift 2 reps immediately
- Owner: Outreach Manager
-
48-hour reply rate
- Trigger: Reply rate < 12% for 3 consecutive days
- Action: Switch to Message B template and add a 48-hour follow-up step
- Owner: Marketing Ops Lead
-
Queue backlog
- Trigger: Backlog > 150 leads for more than 2 hours
- Action: Assign 1 extra rep to SLA queue until backlog < 75
- Owner: Outreach Manager
-
Selection parity ratio
- Trigger: Parity ratio < 0.80 for 3 consecutive days
- Action: Cap any single segment at 35% of daily outreach until parity restored
- Owner: Outreach Manager with Data Analyst support
This turns KPIs into levers instead of FYI.
Play 3: Baselines before benchmarks
Benchmarks are external and often aspirational. Baselines are your normal and operationally useful.
- Baseline: What is normal for this segment and this season?
- Band: What range is acceptable before we act?
- Drift rule: How many consecutive points outside the band trigger the play?
You cannot have a trigger without a baseline.
Play 4: 30-minute Alignment Kickoff
Block 30 minutes before you build.
- “What do we think is happening?”
- “What else could explain it?”
- “What would falsify our belief?”
- “What will we do if the number is higher? Lower?”
You are not just analyzing. You are stress-testing the question.
Play 5: Mini-validation with real users
Before you scale, run a hallway test with 3–5 real users.
- Can they interpret the result?
- Do they know the first action to take?
- When they take it, does the downstream KPI nudge the right way?
Treat confusion as a signal. You just saved months of rework.
Play 6: The Post-Launch Feedback Loop
Adoption decays without maintenance. Schedule a 15-minute review one week after go-live.
- Adoption: daily active users vs. target
- Top praise: 2 quotes
- Top pain: 2 issues we will fix
- Next steps: owners and dates
Make misalignment visible and change safe.
Anti-patterns to retire
- “Insight first, action later.” If the action is not designed in, it rarely appears later.
- “Let’s measure everything.” Volume hides signals. Choose the few KPIs that move behavior.
- “It is a data literacy issue.” Sometimes. More often, it is a decision clarity issue.
- “The dashboard should speak for itself.” Only if you give it verbs — TAO cards give it verbs.
What this looks like in practice
A model flags high-propensity prospects. Decision-first alignment turns that into motion:
- Decision: “Who gets outreach in the first 24 hours?”
- Leading KPIs: Contact rate within 24 hours, reply rate within 48 hours.
- Triggers: If the contact rate drops below 70% for two days, shift queueing rules; if the reply rate drops below 12%, test message B.
- Owners: Outreach Manager for queueing, Marketing Ops for message tests.
- Dashboard design: Queue health at the top with TAO cards, then segment-level trends, then notes field for reasons not contacted.
- Loop: 15-minute weekly huddle to review adoption and friction.
Now the model is not an insight. It is a lever with a hand on it.
The alignment map (simple version)
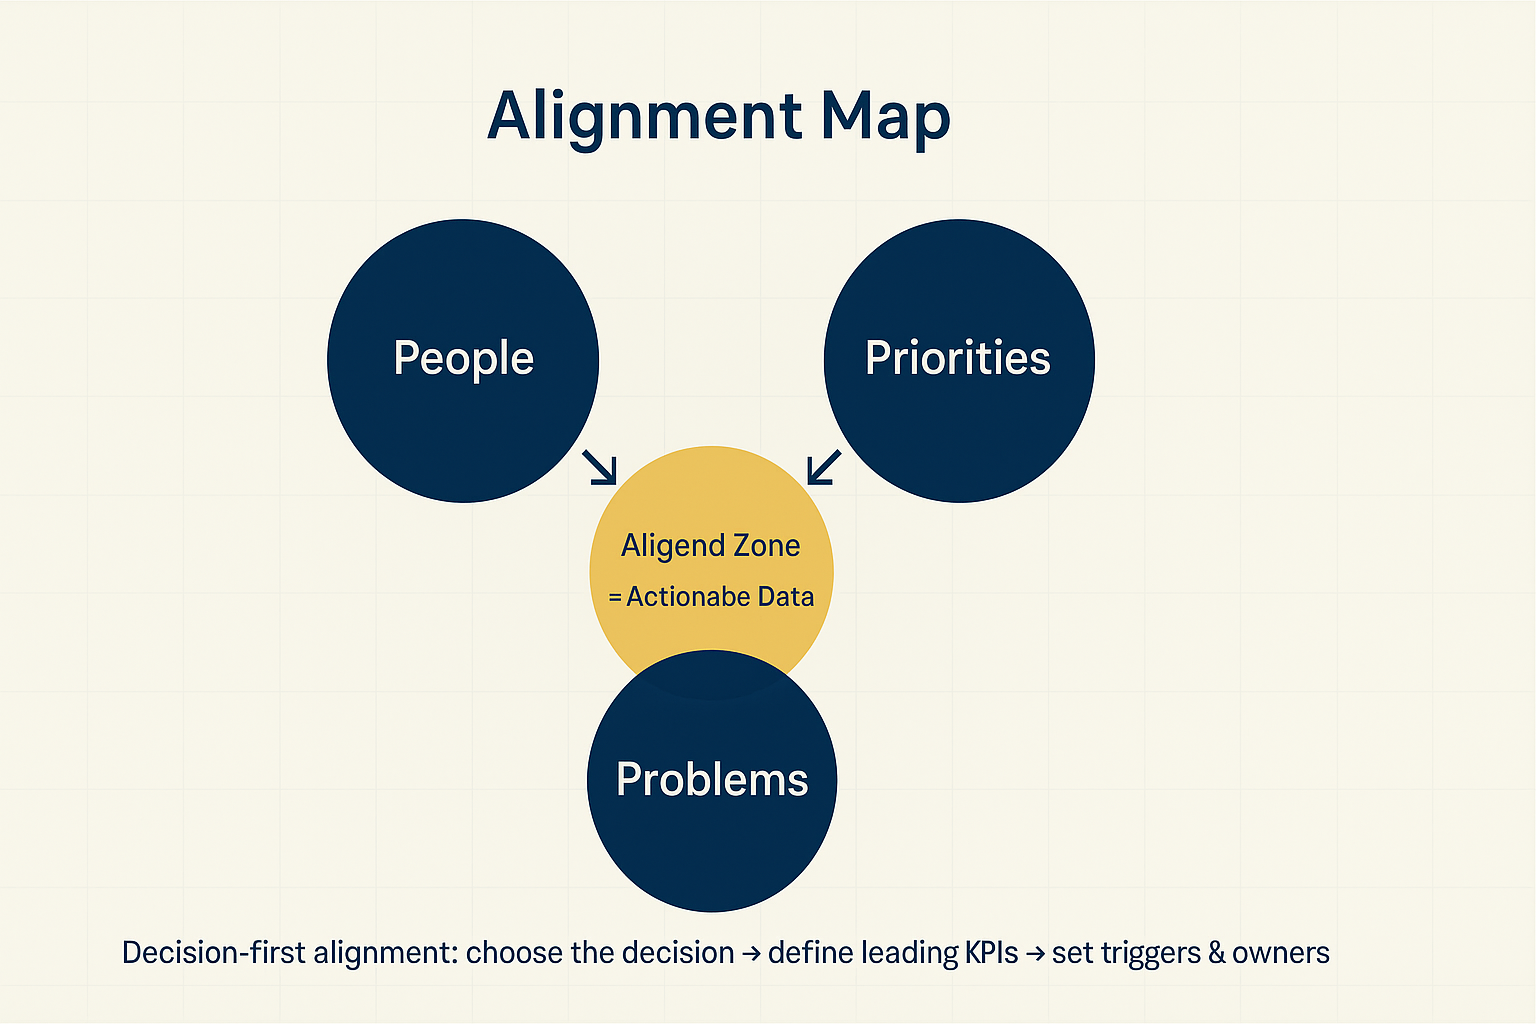
When these three line up around a decision, you get action. When even one drifts, you get stalls, debates, and “we’ll look at it next week.”
The takeaway
Stop wasting good data work on bad or vague questions. What derails most analytics is not error, but ambiguity. Decision-first alignment gives your work a job to do. Choose the decision, pick the few leading KPIs, set the triggers and owners, and build the view that tells people what to do next.
That is how data changes behavior. That is how you get impact.
If this resonates, share it with a leader and a doer who need a common playbook.