Everyone Wants a Dashboard. No One Wants to Do the Cleanup.
Published: June 2025
By Amy Humke, Ph.D.
Founder, Critical Influence
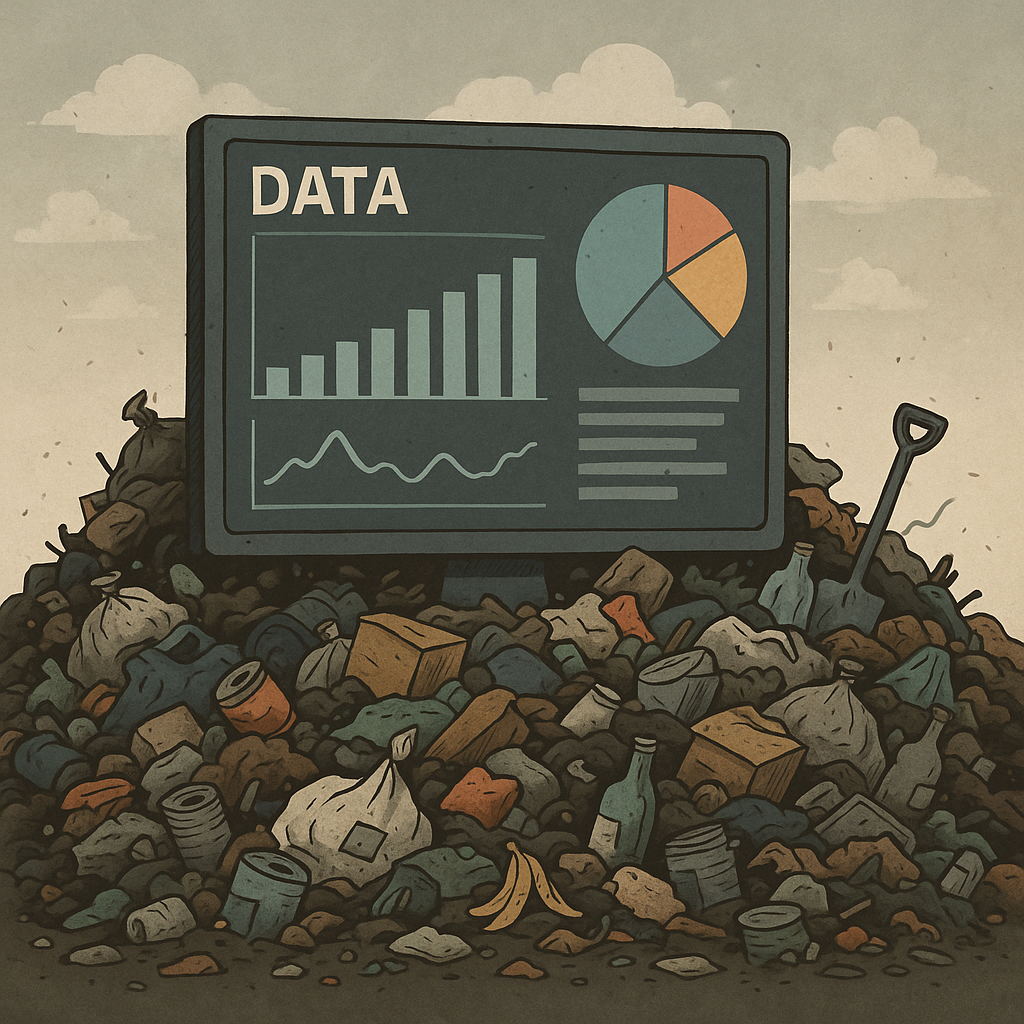
Everyone wants to build dashboards, forecast trends, and make data-driven decisions. But what happens when none of the inputs are clean, consistent, or complete?
Too often, the urgency to act leads teams to rush straight to the dashboard, skipping critical steps like validation, standardization, and ownership. The problem? If your foundation is flawed, so are the decisions built on top of it.
But here's the catch: some metrics really can't wait. You can't delay reporting key numbers until your whole data infrastructure is perfect. So, how do you move quickly and build responsibly?
This article lays out a pragmatic path to doing just that.
It's Overwhelming to Start. That's Normal.
Many teams find themselves staring at messy spreadsheets, unclear field definitions, and conflicting reports, and think, "Where do we even begin?"
You're not alone. The gap between where you are (no clear ownership, no documentation, no consistent processes) and where you think you need to be (data governance, a fully defined and mapped data dictionary, automated pipelines, complete metadata, and full compliance) can feel insurmountable.
That sense of overwhelm often leads to paralysis. Or worse, rushed solutions that feel productive but create more problems.
The answer? Start small. Start with what breaks things.
Yes, Some Metrics Really Can't Wait
Sometimes, you need to launch the dashboard before the foundations are ready.
You're being asked for:
- Compliance reporting with strict deadlines and steep fines for missing them
- Audit reports
- Quarterly KPIs to ensure the business is on track
These requests don’t wait for perfect data governance. But that doesn’t mean anything goes.
The goal isn’t perfect data. It’s defensible data. Data you can stand behind, explain, and improve over time.
Auditors and regulators don’t expect perfection. They expect a clear, documented process, proactive correction of issues, and visible effort to manage risk. And business leaders don’t need flawless dashboards; they need decision-ready ones that are trustworthy enough to act on.
That’s why smart triage matters. Not every fix needs to be made before you move, but you do need to know what you’re standing on.
A Two-Tiered Approach
Tier 1 (Faster): Urgent Metrics
- Identify 1–3 high-priority metrics driving current decisions.
- Trace the fields that those metrics depend on.
- Audit just those fields for missing, invalid, or conflicting values.
- Validate those fields against external sources or related metrics.
Tier 2 (Slow, Continuous): Foundational Cleanup
- Catalog known data sources.
- Start a lightweight dictionary: What does this column mean? Who uses it?
- Document recurring problems: where they happen and what they break.
- Identify ambiguous or misleading field labels and clarify their meaning across teams.
This lets you act fast and act smart.
What Happens If You Skip It All?
The risks of bad data aren't hypothetical. They're routine:
- A national nonprofit over-reported its reach by 22% due to duplicate client records, jeopardizing funding.
- A college miscalculated enrollment trends because the "start date" wasn't standardized, leading to overstaffing in low-demand programs.
- A retailer launched a loyalty campaign using outdated contact data, frustrating loyal customers and harming brand trust.
Beyond public-facing issues, bad data has internal consequences too:
- Data scientists spend 60% of their time on cleanup.
- Missed grant deadlines due to flawed reporting.
- Strategic decisions are delayed because no one trusts the numbers.
Bad data doesn't just break your dashboards. It breaks your credibility.
The Minimum You Can't Skip
You don't need enterprise tools or a full-time data team to protect against the worst issues. Here's a shortlist of the bare-minimum checks that prevent the most common and costly mistakes:
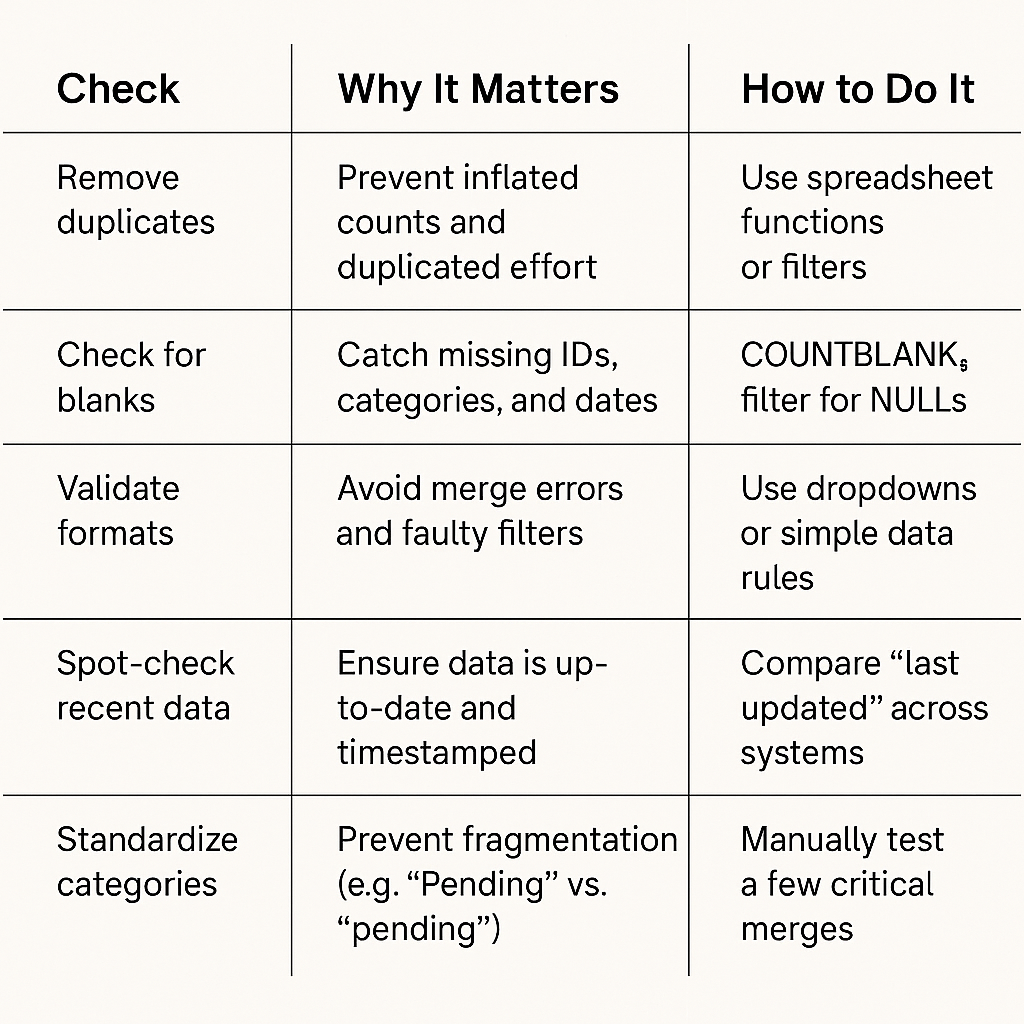
If all you did this week was audit your most-used metric for these six issues, you'd already cut downstream confusion in half. But if you only have time for one, start with duplicates. It's the single most common and most corrosive data quality issue.
And don’t stop at checking the system-assigned IDs. True duplicates often hide behind different IDs but share the same name, email, or address. Trust in your data begins by ensuring you’re not counting the same person twice.
Understand the 7 Dimensions of Data Quality
Data quality isn't just one thing. It's a combination of measurable dimensions that, together, define whether data is truly fit for use:
- Accuracy – Is the data correct and truthful?
- Completeness – Are all required values present?
- Consistency – Does the data match across systems?
- Timeliness – Is the data current and available when needed?
- Validity – Does the data conform to rules and formats?
- Uniqueness – Is each record distinct with no unnecessary duplication?
- Integrity – Are relationships between datasets maintained correctly?
Use these dimensions to build a data quality dashboard. Track each metric for your highest-impact datasets. Show trends. Set thresholds. Create alerts. When data quality becomes visible, it becomes fixable.
What’s in a Name? Turns Out, a Lot.
Sometimes, the biggest problems aren’t in the data values; they’re in the labels.
Take a checkbox labeled “Chronic Condition.”
It was added to a patient intake form to flag individuals who need long-term care coordination. But the form was rolled out across multiple departments—nursing, intake, billing, and case management—without a shared definition.
- The intake team checks it if the patient mentions asthma or high blood pressure.
- The case management team only checks it for complex conditions like diabetes, cancer, or COPD.
- Billing checks it if it triggers insurance requirements, even if the condition has been resolved.
- And in urgent care, it’s checked if the patient has any ongoing medication, even if it’s for seasonal allergies.
The result? A report shows that 82% of incoming patients have a chronic condition, triggering executive concern and potentially new workflows, resources, or compliance measures.
The metric validates. The math is correct. No duplicates. But the interpretation is flawed because the definition wasn’t shared.
This isn't a data integrity issue. It's a semantic drift—quiet, invisible, and costly.
The same field is being entered differently depending on who touches it. No one is wrong, but everyone’s working from a different understanding of what that checkbox means.
What to Do
- Involve multiple teams when defining data entry fields, not just report consumers.
- Document those definitions and usage assumptions clearly.
- Periodically retrain teams to keep interpretations aligned.
Data ambiguity is most dangerous at the point of entry because by the time you see the error, it’s already been trusted.
Who Owns the Mess? Nobody, Usually.
Confusing labels don’t just trip up your reports; they reveal a deeper issue: no one feels responsible for making sure the data is understood, maintained, or trusted.
That ambiguity in meaning is often matched by ambiguity in ownership.
And when no one owns the definition, no one owns the fix.
Does this scenario sound familiar?
- An analyst spots an error and flags it to IT.
- IT says it’s a business issue.
- The analyst tries to trace it back to whoever entered the data.
- The business team shrugs, assuming IT will handle it.
The issue lingers. Everyone sees it. No one claims it.
Meanwhile, the analyst needs to get the report out so they hard-code a fix.
It works for now. But what’s the downstream cost?
- Reports stop matching. One report uses the hard-coded fix; another pulls directly from source data. Leadership loses trust when numbers don’t align.
- Knowledge silos form. Only the person who applied the fix understands what was changed and why. If they leave, the logic goes with them.
- Technical debt accumulates. Patches get layered on top of patches. Over time, no one knows which version of the truth is correct or why it was written that way in the first place.
- Manual work multiplies. What should be a one-click refresh becomes a series of undocumented workarounds. More effort, less value.
- Root causes get buried. Each new fix makes the underlying problem harder to spot. Eventually, the organization starts accepting bad data as a “known quirk.”
- Audit risk increases. In regulated industries, undocumented logic changes can violate compliance standards, even if well-intentioned.
- Future automation fails. Temporary fixes often don’t translate into automated systems or ETL pipelines. The workaround breaks at scale.
- Your team becomes the bottleneck. Once you’re the only one who “knows how to make the data work,” everything depends on you, and it burns you out.
A Better Model
- Distribute stewardship: assign owners based on who knows the data best, not who has the least power to push back.
- Define roles clearly: one person might maintain the system, another defines the field, and a third reviews usage.
- Engage in smart cleanup: use IT processes to automate fixes where possible. If manual cleanup is needed, resource it properly.
- Celebrate cleanup: don't just track errors, highlight fixes. Normalize surfacing issues as a contribution, not a failure.
When ownership is shared, structured, and supported, data quality becomes everyone's job and no one's burden.
Governance Isn't Real Until It Has Teeth
Many organizations assign someone to "lead data governance" and then strip them of power.
They can recommend changes but not enforce them. Document definitions but not ensure they're used. Flag issues but not prioritize the fix.
That's not governance. That's note-taking.
To Make Governance Work
- Give governance leads real decision rights over standards, priorities, and timelines.
- Align governance to business outcomes, not just compliance.
- Enable them to delegate work, escalate blockers, and assign accountability.
Good governance builds clarity. Great governance builds action.
Building a Data-Aware Culture
Frontline employees enter the data. They're your first line of quality control.
But if they don't understand why the data matters, errors will keep slipping through.
They're not just entering numbers. They're providing the foundation for decisions, funding, compliance, and customer experiences.
What Culture Looks Like
- Context: help teams see how their work impacts reports and decisions.
- Clarity: define entry rules clearly and simply.
- Confidence: let them know it's okay to ask questions or raise issues.
- Consistency: reinforce expectations regularly, not just once at onboarding.
When people understand that their small data actions have big downstream impacts, quality becomes a shared value, not just a rule.
Empowerment Isn't Optional
If the only people fixing data are senior analysts and data scientists, your system is broken. They're too far downstream.
What Empowerment Looks Like
- Clear entry rules: what's required, what formats, what values.
- Basic tools: dropdowns, validations, templates.
- Visibility: show how data quality affects reports that people care about.
- Support: when errors surface, people get help, not heat.
When data stewards and frontline staff are equipped and trusted to fix problems or prevent them, you build a system that scales.
Final Word: Start Small. But Start.
Data quality feels like a mountain. But you don't need to conquer it this quarter.
You just need to:
- Pick the metrics that matter most.
- Run the checks that catch the big issues.
- Share ownership; don't bury it.
- Empower everyone who touches the data.
- Give your governance structure a voice.
- Build a culture that treats data not as a burden but as a reflection of what your organization values.
Don't wait for the perfect data system. Trust is built one fixed field at a time.