From Chaos to Confidence: A Practical Roadmap for Analytics Maturity
Published: June 2025
By Amy Humke, Ph.D.
Founder, Critical Influence
The Data Maturity Myth: Why 92% of Companies Are Flying Blind
The rise of AI has captured executives' imaginations, yet most organizations are unprepared for true analytics maturity. According to a 2024 BCG Data & AI Capability Maturity Assessment (DAICAMA), only 8% of organizations qualify as truly mature in data and AI. This leaves 92% facing significant hurdles with data governance, data quality, and a unified understanding of metrics — despite 95% actively pursuing AI initiatives. LLM tools and generative AI are not automatic shortcuts to maturity.
The path to maturity starts with understanding what analytics maturity enables — and why so many companies push ahead despite foundational gaps.
Why Companies Care About Analytics Maturity
Organizations pursue analytics maturity for one reason: impact.
Companies with mature analytics capabilities scale more use cases, extract greater value from each, and make better, faster decisions. According to BCG, leading firms achieve 4× more scaled use cases and 5× the financial impact per initiative than their less mature peers.
Maturity avoids common traps like siloed reporting, model misalignment, and wasted investment. It creates a feedback loop of learning, optimization, and innovation competitors can't replicate.
Analytics maturity also aligns data work with business strategy. Mature organizations don't just generate reports — they shape the direction of the company. Data becomes part of strategic planning, not just operational cleanup.
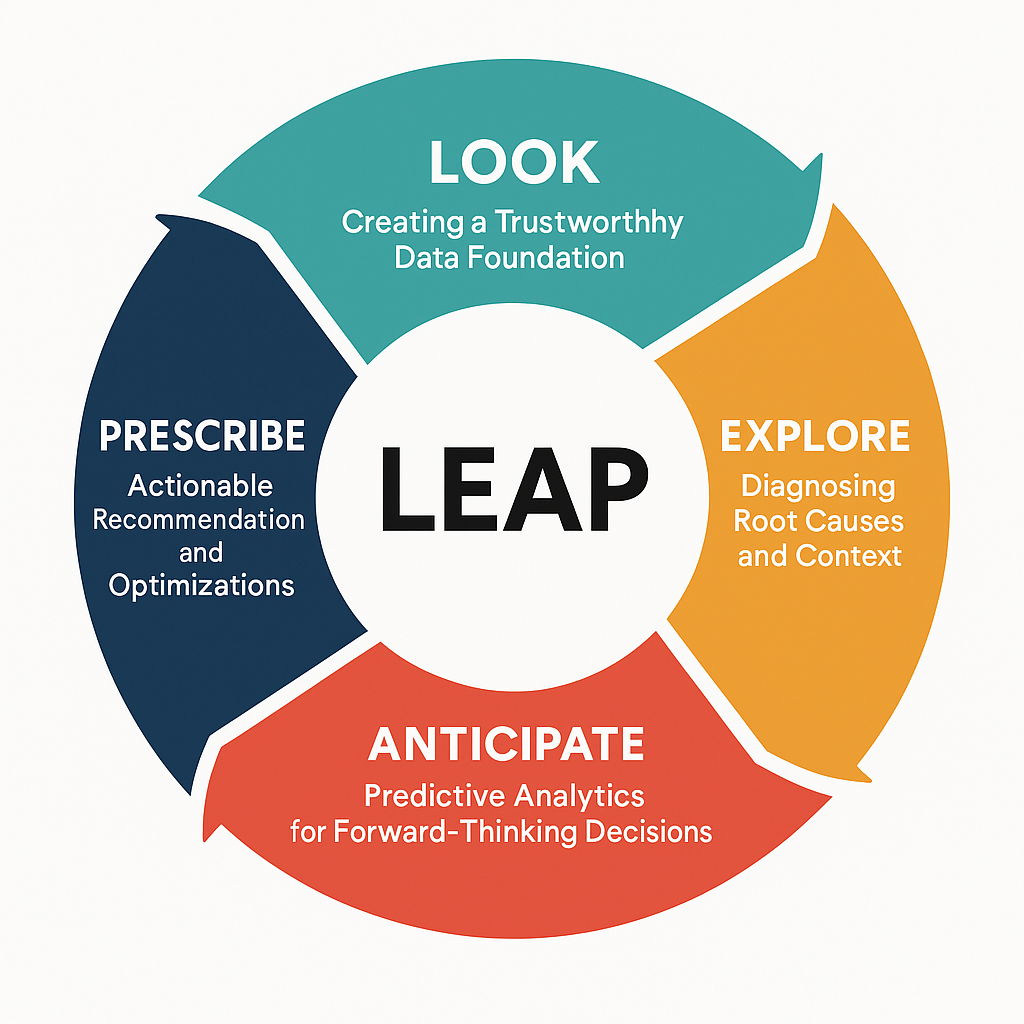
LEAP: A Detailed Framework for Data Analytics Maturity
Analytics maturity is not linear. It's cyclical. The LEAP framework includes four phases:
- LOOK — Establish trustworthy data foundations
- EXPLORE — Diagnose root causes and capture context
- ANTICIPATE — Build forecasting and predictive models
- PRESCRIBE — Deliver recommendations and take action
LOOK: Creating a Trustworthy Data Foundation
Every analytics initiative starts with: Can we trust the numbers? If the answer isn’t an immediate “yes,” that uncertainty will ripple through every decision.
Trustworthy data requires:
- Metric definitions and documentation
- A centralized data dictionary
- Clear ownership and accountability
- Embedded quality expectations in job roles
Implementation Steps:
- Conduct comprehensive data audits
- Establish a centralized data dictionary
- Assign ownership and accountability
- Implement automated validation and monitoring
Actionable Practice:
Tie data quality to performance reviews so it's a shared responsibility — not just IT's job.
Signs of Success:
- Unified data sources across departments
- Executives trust and act on data
EXPLORE: Diagnosing Root Causes and Context
Explanations matter as much as insights. Without context, data can’t explain why.
Make business context accessible by:
- Logging initiatives (launch dates, targets, etc.)
- Linking changes to metrics and events
- Training analysts in drill-downs and decomposition
- Facilitating regular cross-functional reviews
Actionable Practice:
Start with a simple initiative log table and pair events with performance trends.
Signs of Success:
- Analysts explain changes clearly
- Data shifts are tied to real-world events
ANTICIPATE: Predictive Analytics for Forward-Thinking Decisions
Descriptive tells you what, diagnostics tells you why — but predictive tells you what’s next.
Foundations for good forecasting:
- Clean, complete historical data
- Understanding of uncertainty and error
- Models that are interpretable and trustworthy
Implementation Steps:
- Build and validate historical datasets
- Train teams in forecasting and scenario planning
- Align predictions with planning cycles
- Establish alert systems tied to predictive thresholds
Actionable Practice:
Start with seasonal trend analysis. Even simple models can sharpen planning if you review and adjust regularly.
Signs of Success:
- Forecasts shape planning, not just reports
- Teams act on leading indicators
- Fewer surprises, faster recovery
PRESCRIBE: Actionable Recommendations and Optimizations
Prescriptive analytics answers: What should we do about it?
This is the bridge from insight to action. Prescriptive models must:
- Reflect business logic and constraints
- Be interpretable and explainable
- Monitor results and improve over time
Implementation Steps:
- Identify high-impact decisions
- Build models with business logic
- Validate recommendations
- Monitor adoption and iterate
Actionable Practice:
Start with embedded "if-then" rules in dashboards. Example: “If conversion drops below X%, trigger call campaign.”
Signs of Success:
- Business users trust recommendations
- Decisions reflect model input
- Feedback loops drive improvement
Assessing Data Maturity with the LEAP Scorecard
Before diving into AI, ask:
- Adoption ≥ 70%? Are people using what you built?
- Is data lineage documented? Can you trace each metric?
- Is a model in production? Is it being used — not just demoed?
- Is data ROI tracked or planned? Is value being measured?
If you answered "no" to two or more, shore up the foundation before scaling.
Why Companies Jump Ahead Despite Immaturity
Despite the risks, companies pursue AI due to:
- Competitive Pressure: Fear of falling behind
- Easy Access to Tools: Perceived low barrier to entry
- Leadership Underestimation: Misjudging the effort to reach maturity
Short-term leaps can yield short-term gains — but sustainable value demands a solid foundation.
"Good Enough" Analytics and Continuous Improvement
Perfect maturity isn’t required to make progress — but you must:
- Be transparent about limitations
- Build on early success
- Establish feedback loops
A Realistic, Metric-by-Metric Roadmap
Don’t fix everything. Start with one metric for 12 months, then move on.
Example: Enrollment KPI
Quarter 1 (LOOK)
- Audit systems, define metrics
- Build gold tables and data dictionary
- Assign ownership and data quality checks
Quarter 2 (EXPLORE)
- Build an initiative/event log
- Link events to outcomes
- Cross-functional review of anomalies
Quarter 3 (ANTICIPATE)
- Build a baseline model
- Align it with planning cycles
- Embed forecast into dashboard
Quarter 4 (PRESCRIBE)
- Flag at-risk points
- Recommend actions
- Track interventions and impact
- Close the loop with review + refinement
From Buy-In to Built-In
In mature orgs, analytics is the norm — not the exception.
- Build it into planning cycles
- Highlight wins
- Reinforce quality and collaboration
- Normalize data-informed decision-making
Continuous Improvement: A Dynamic Journey
Stay agile:
- Revisit maturity regularly
- Iterate on tools and processes
- Communicate outcomes and learnings
Final Thought: Navigating Data Maturity Together
Maturity is a journey — not a checkbox.
With the LEAP cycle, you can move forward intentionally, build trust, and unlock the real impact of analytics.